Recap: Out of Thin Air — Making Indoor Air Quality Data Make Sense
On Friday 6 March, the EDIAQI Webinar Series hosted a new session titled “Out of Thin Air: Making Indoor Air Quality Data Make Sense.” The discussion explored a growing challenge in indoor air quality (IAQ): while sensors and monitoring technologies now generate vast amounts of environmental data, the real difficulty lies in translating that data into insights that support meaningful action.
Affordable IAQ sensors — many of which have fallen dramatically in cost over the past decade — are transforming buildings into continuous data environments. Classrooms, offices and public buildings can now generate thousands of data points per day across pollutants such as CO₂, particulate matter, temperature and humidity. Yet as monitoring becomes easier, the challenge increasingly becomes interpretation rather than measurement. IAQ data is complex, variable and context-dependent, and dashboards must balance scientific integrity with usability.
Bringing together expertise from environmental monitoring, digital twins, UX design and behavioural research, the webinar explored how IAQ data can move from raw measurement to actionable intelligence.
Engineering Clarity: Turning Data into Action
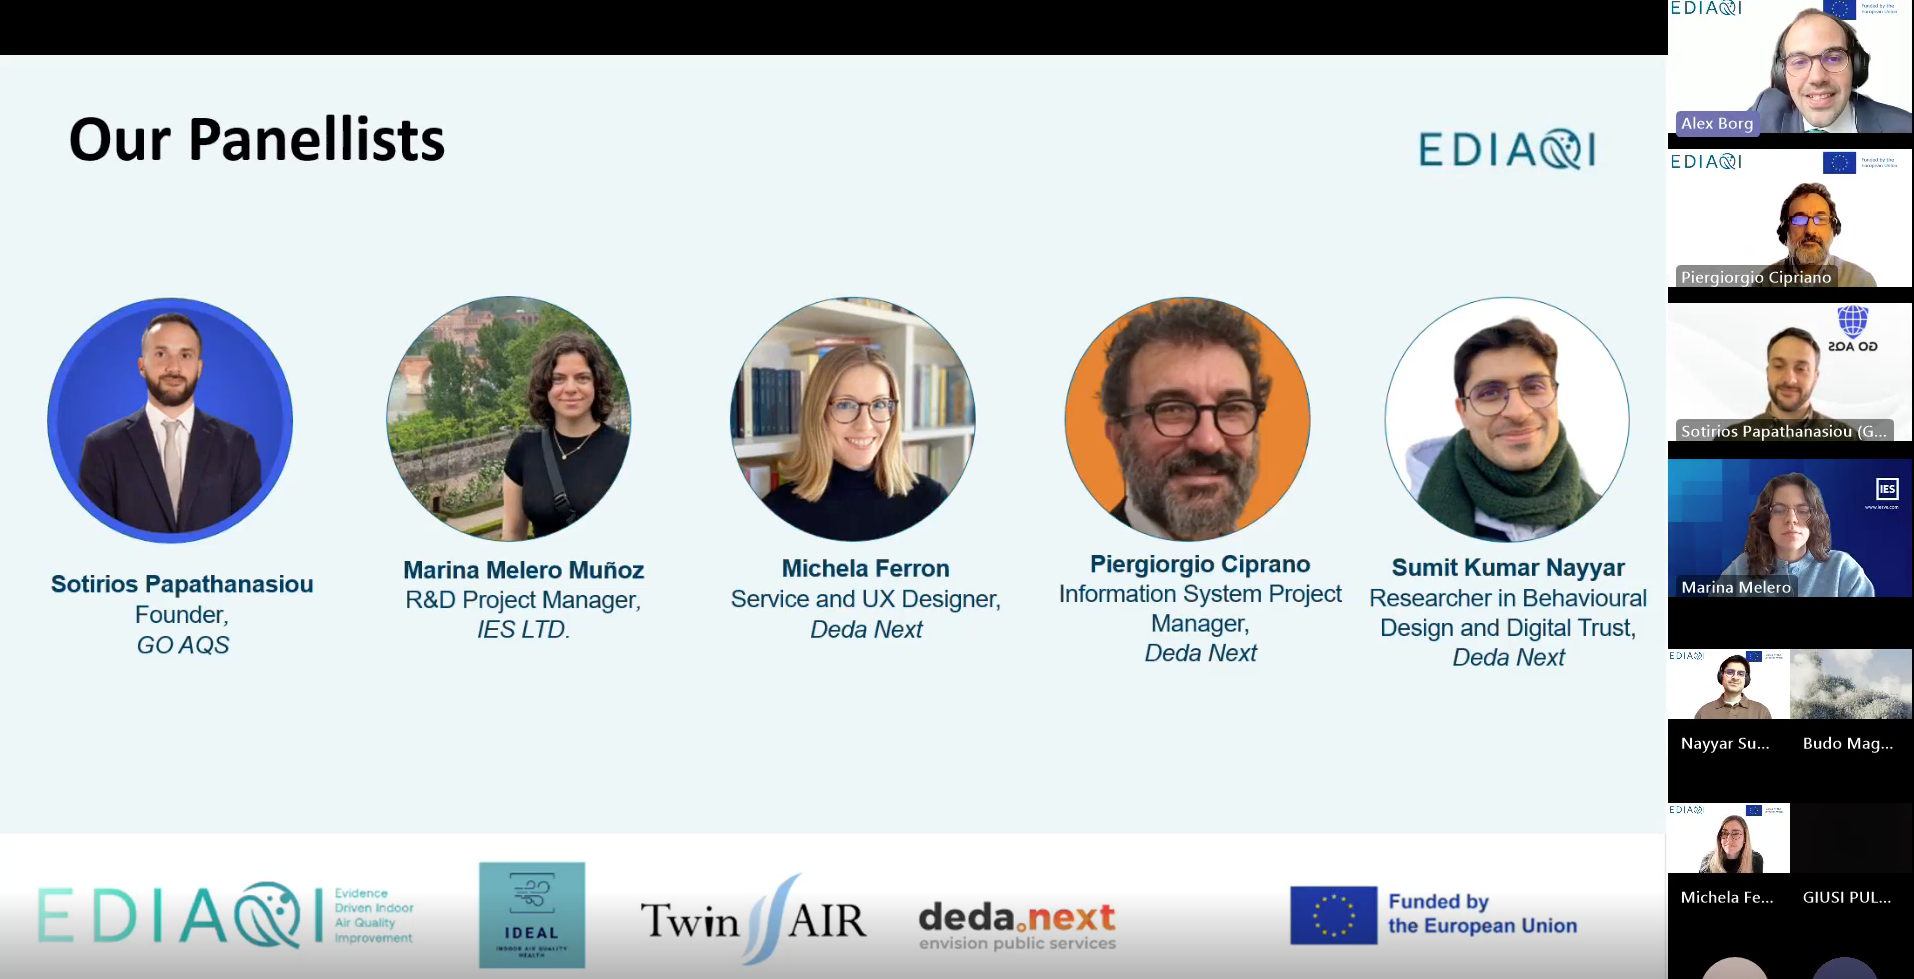
The session opened with Sotirios Papathanasiou, founder of GO AQS, who examined how IAQ data can be translated into signals that people can understand and act upon.
While modern monitoring systems generate detailed environmental data, most building managers and occupants do not need raw pollutant concentrations. Instead, they require clear indicators that explain when and why action is needed. Composite scores and structured thresholds can help transform complex measurements into understandable signals that support decision-making.
At the same time, Papathanasiou emphasised that simplification must be handled carefully. Colour-coded indicators and aggregated indices can create false reassurance if uncertainty and context are not communicated clearly. Effective dashboards therefore balance simplicity with transparency, ensuring users understand both the meaning and the limits of the data.
Digital Twins and Responsible Decision Support
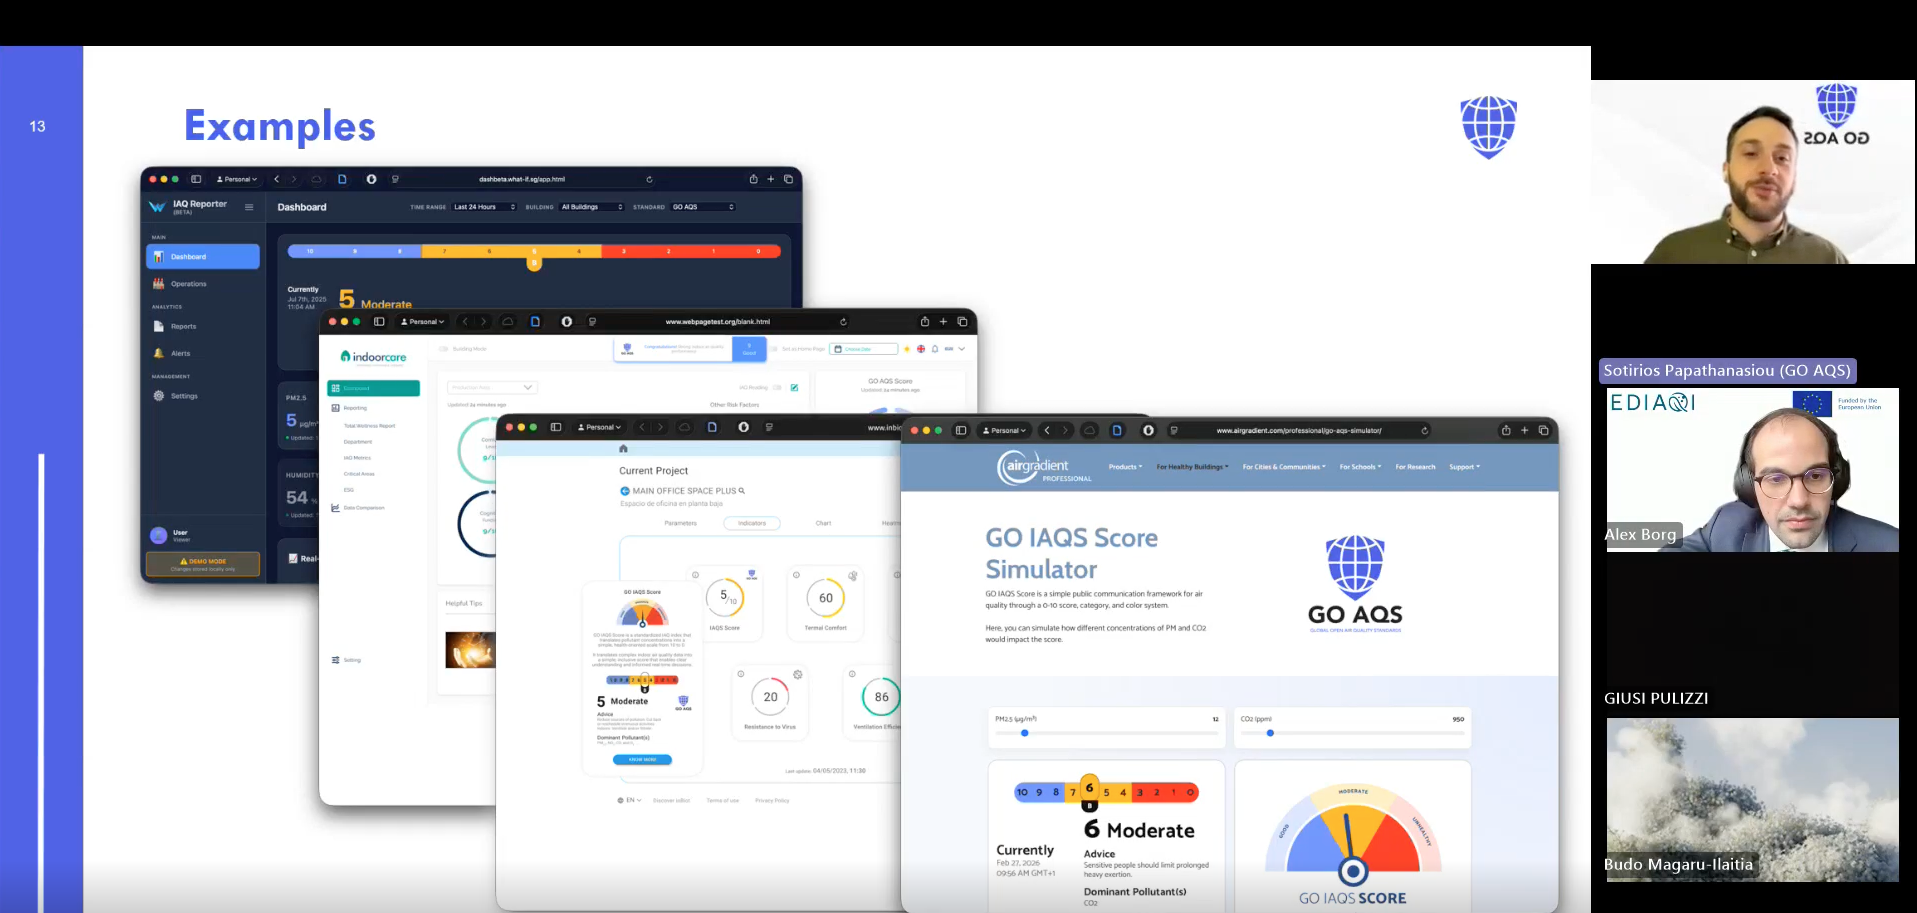
Marina Melero Muñoz, R&D Project Manager at Integrated Environmental Solutions and representative of the TwinAir project, explored the role of digital twins in IAQ monitoring.
Digital twins combine sensor networks, simulation models and analytics to create dynamic representations of indoor environments. This allows IAQ systems to move beyond monitoring towards predictive and decision-support tools, linking air quality data with energy performance, ventilation strategies and occupant wellbeing.
Melero highlighted that digital twin dashboards must remain transparent and policy-aligned, particularly when informing building management decisions or renovation strategies. By integrating sensor data with modelling and health indicators, digital twins can help translate complex environmental signals into actionable insights for building operators and policymakers.
Designing Dashboards People Can Use
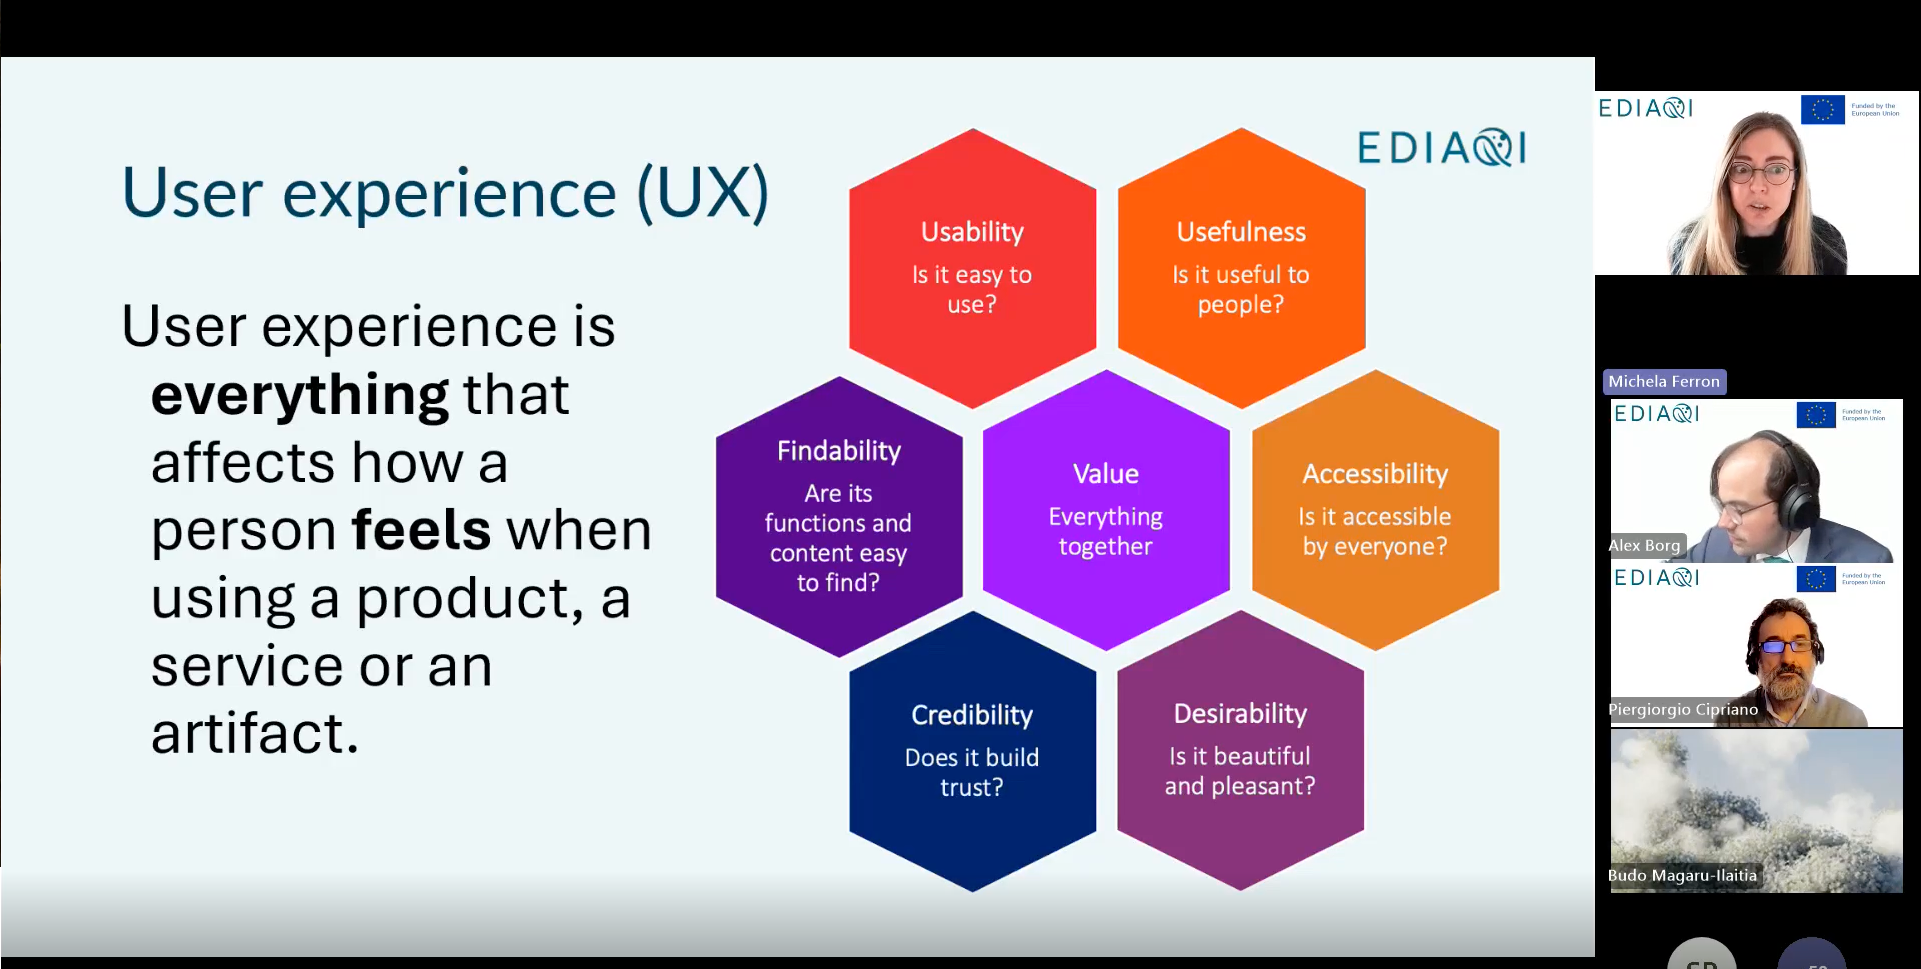
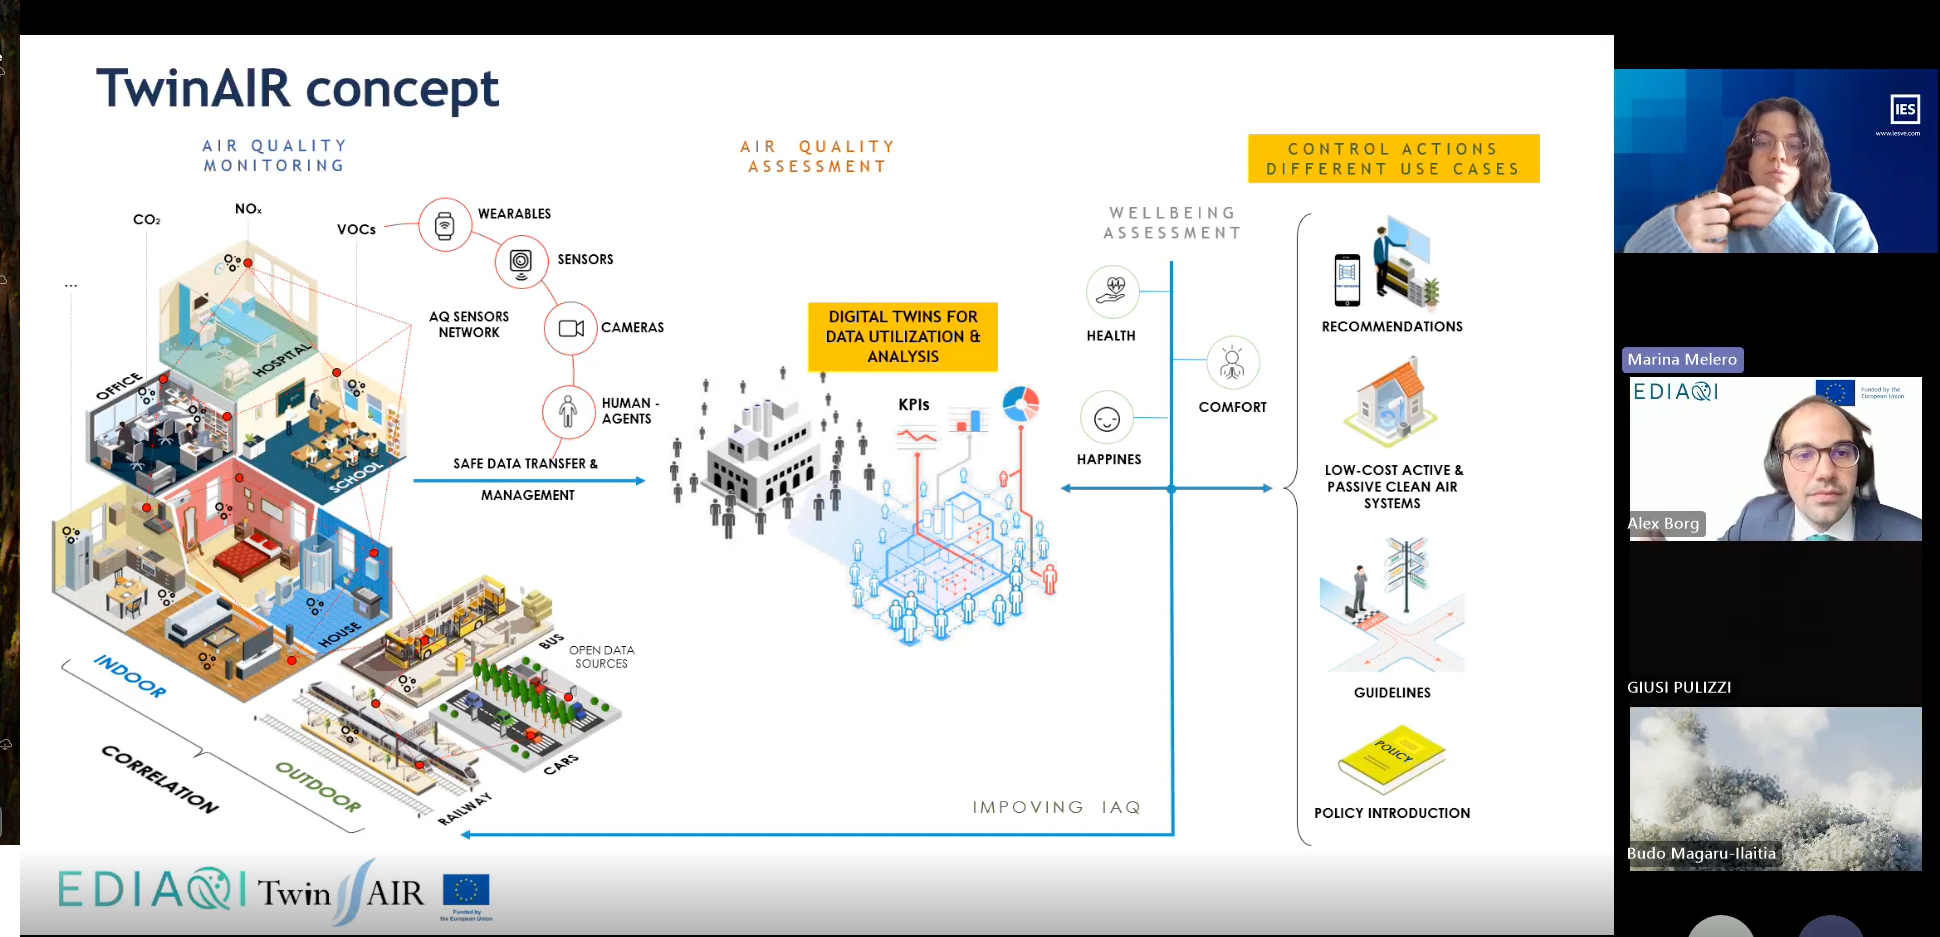
Michela Ferron, Service and UX Designer at Deda Next, presented the design work behind the Ferrara IAQ dashboard, developed within the EDIAQI pilot.
Through co-design with building occupants, including schools and offices, the team discovered that many users struggle to interpret technical environmental dashboards. Graphs and pollutant metrics often fail to answer the question users care about most: what does this mean and what should I do?
Ferron emphasised that effective dashboards must therefore prioritise clarity, context and actionability. Rather than simply presenting environmental data, interfaces should help users understand health implications and possible responses. This reflects a broader shift from data provision to decision-support systems.
From Prototype to Scalable Digital Infrastructure
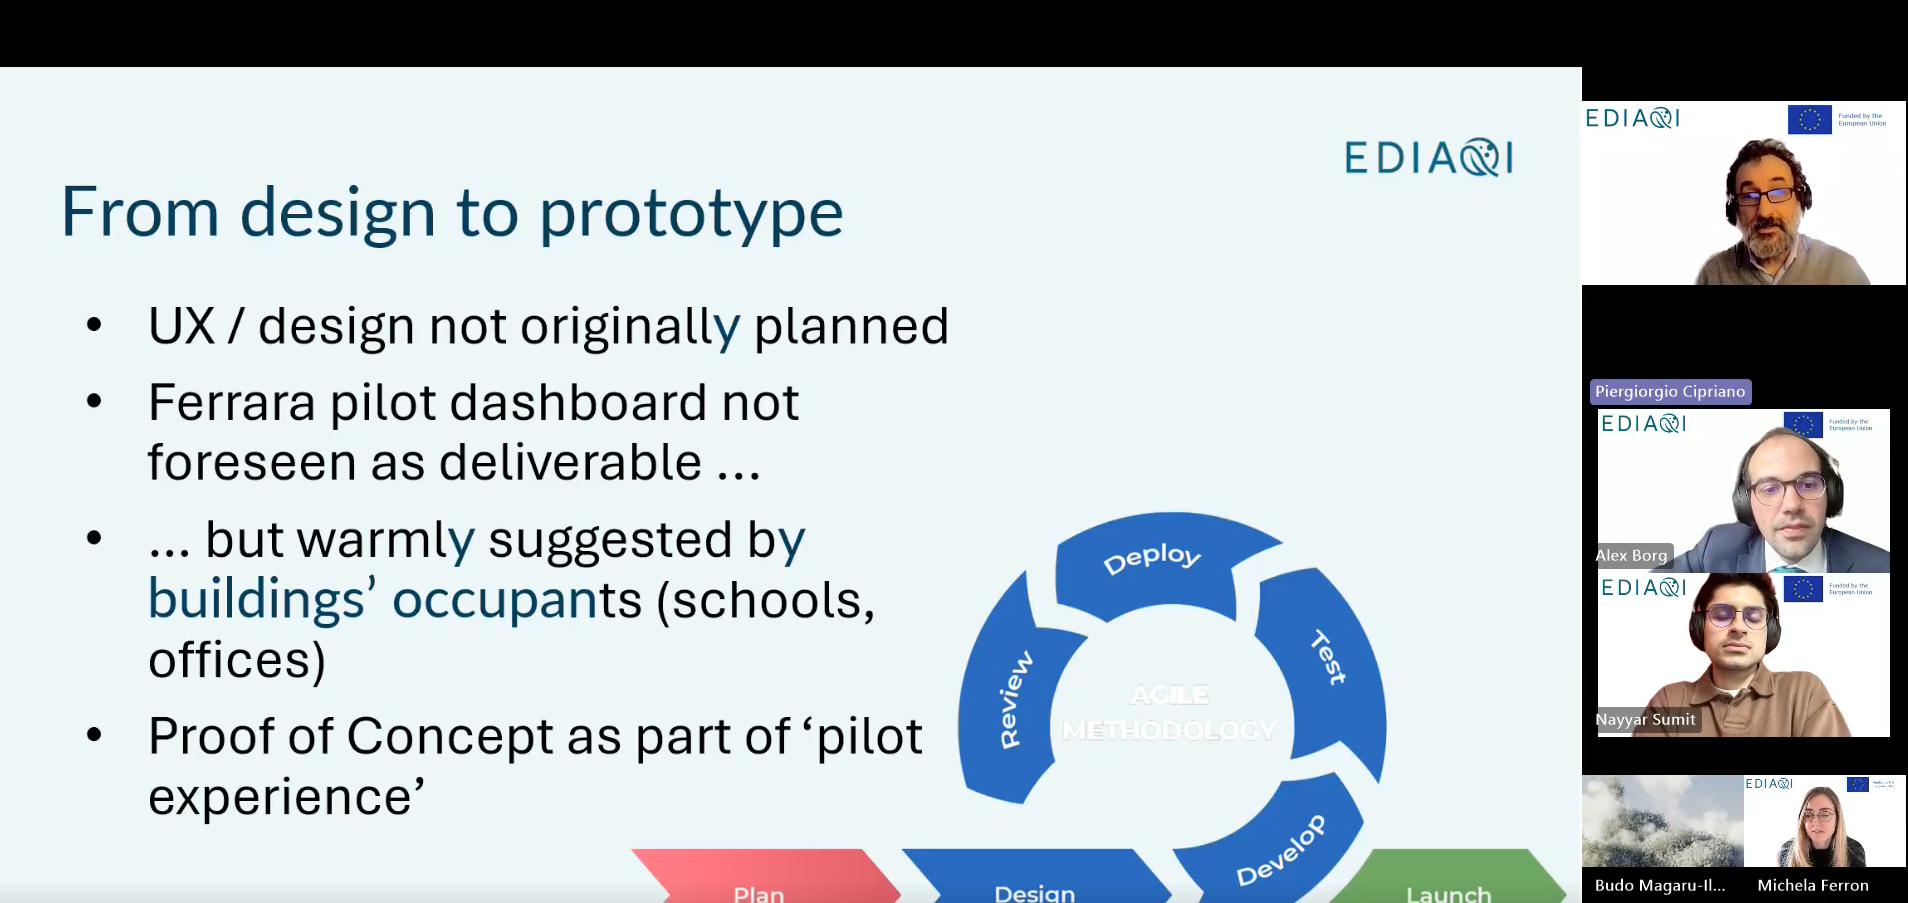
Building on the Ferrara experience, Piergiorgio Ciprano discussed what it takes to scale a pilot dashboard into a sustainable digital solution.
While research projects often produce promising prototypes, transforming them into operational platforms requires robust architecture, interoperability and long-term governance. The Ferrara dashboard evolved from a proof-of-concept into a system capable of integrating multiple data streams through standardised APIs and scalable infrastructure.
As IAQ monitoring becomes increasingly embedded in public decision-making, Ciprano stressed that dashboards must evolve into reliable digital infrastructure, supported by clear governance and sustainable operational models.
From Data Provider to Intelligence Provider
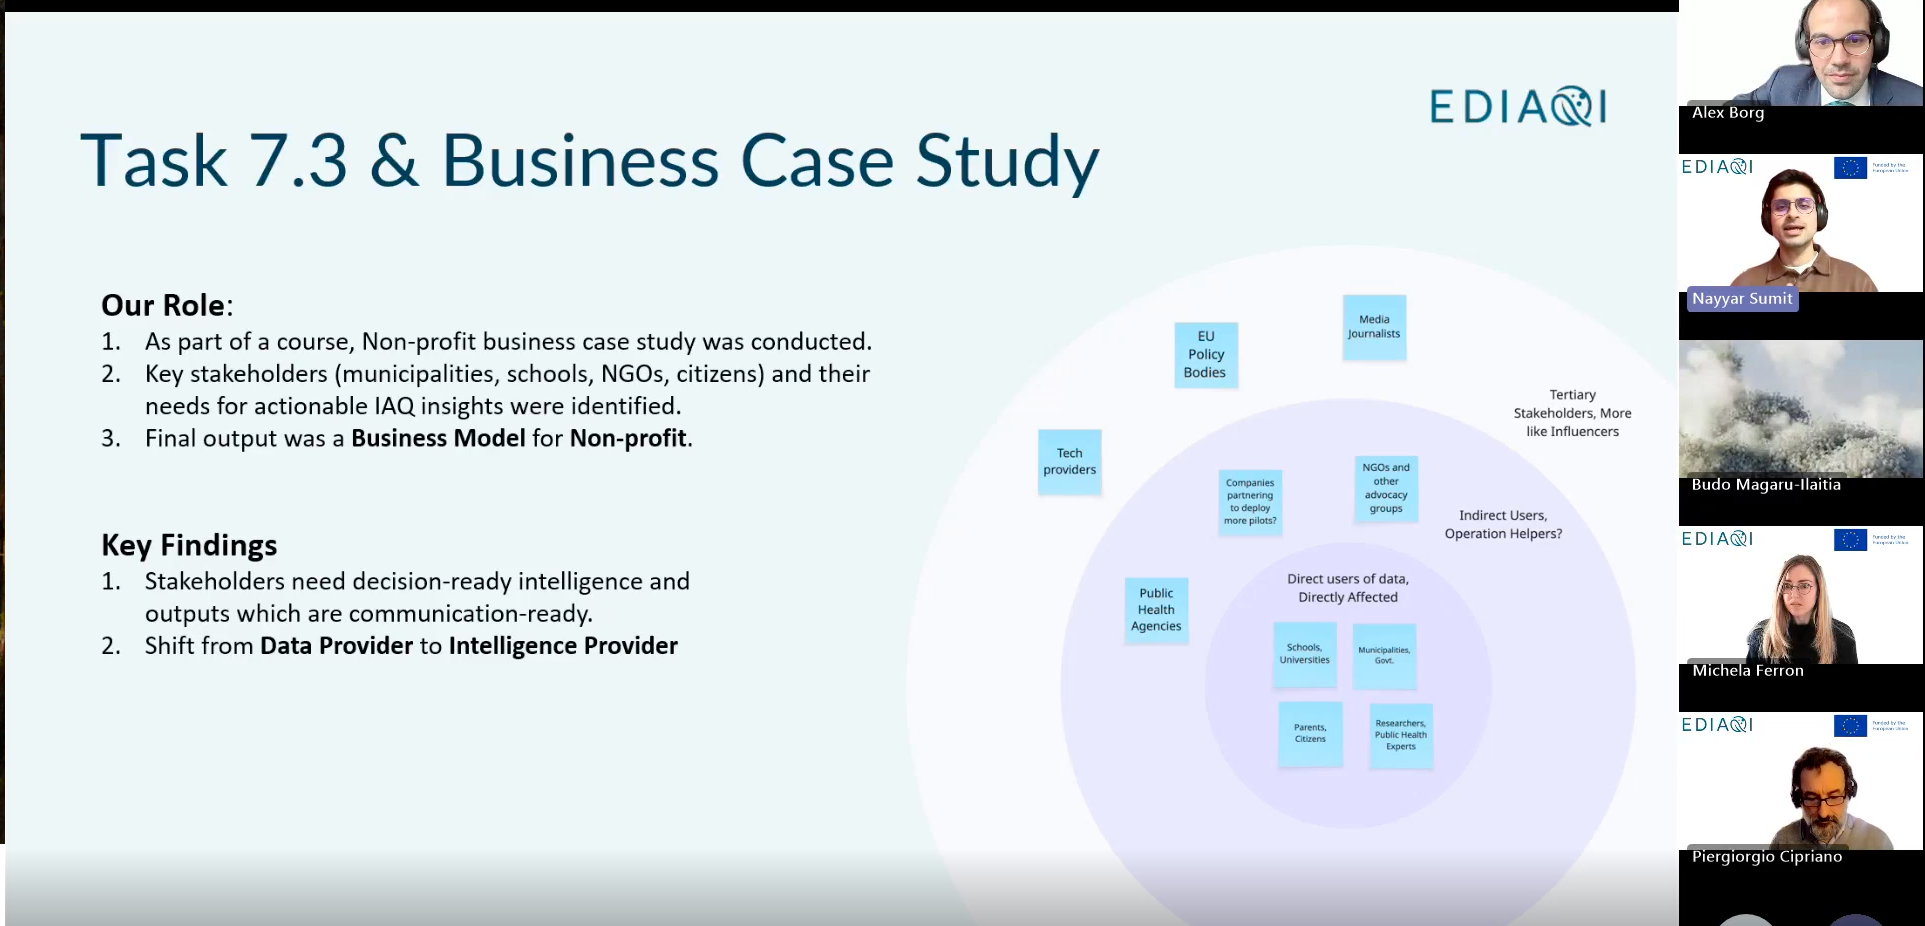
Sumit Kumar Nayyar, researcher in behavioural design and digital trust at Deda Next, explored the stakeholder and market perspective of IAQ dashboards.
Research conducted within EDIAQI showed that many stakeholders — including municipalities, schools and building managers — require outputs that are communication-ready and decision-oriented. Environmental data must often be explained not only to technical experts but also to parents, administrators and policymakers.
Nayyar emphasised that behavioural design and digital nudging can help dashboards communicate health relevance and encourage appropriate action. This approach reframes IAQ platforms as tools for translating environmental data into practical intelligence.
Key Takeaways
Three key messages emerged from the discussion:
- The challenge in IAQ monitoring is shifting from data collection to interpretation
- User-centred design is essential to ensure dashboards support real-world decisions
- Digital twins and advanced analytics can help translate monitoring data into predictive and policy-relevant insights
Watch the Recording and Stay Engaged
The full recording of “Out of Thin Air: Making Indoor Air Quality Data Make Sense” will soon be available on the EDIAQI YouTube Channel, alongside the presentation slides shared by the speakers.
The webinar highlighted that improving indoor air quality is not only a technical challenge, but also a question of design, governance and trust — ensuring that the growing wealth of environmental data ultimately supports healthier buildings and better decisions.